Dashboards that show what actually matters
See callback rates, recurring revenue, chemical usage, and technician performance in one place.
Callback tracking that shows where service is slipping
Spot service quality issues fast by seeing which routes, techs, or service types are driving callbacks before repeat problems pile up.
Chemical usage reports
Measure product usage across jobs, technicians, and accounts without waiting for end-of-month cleanup.
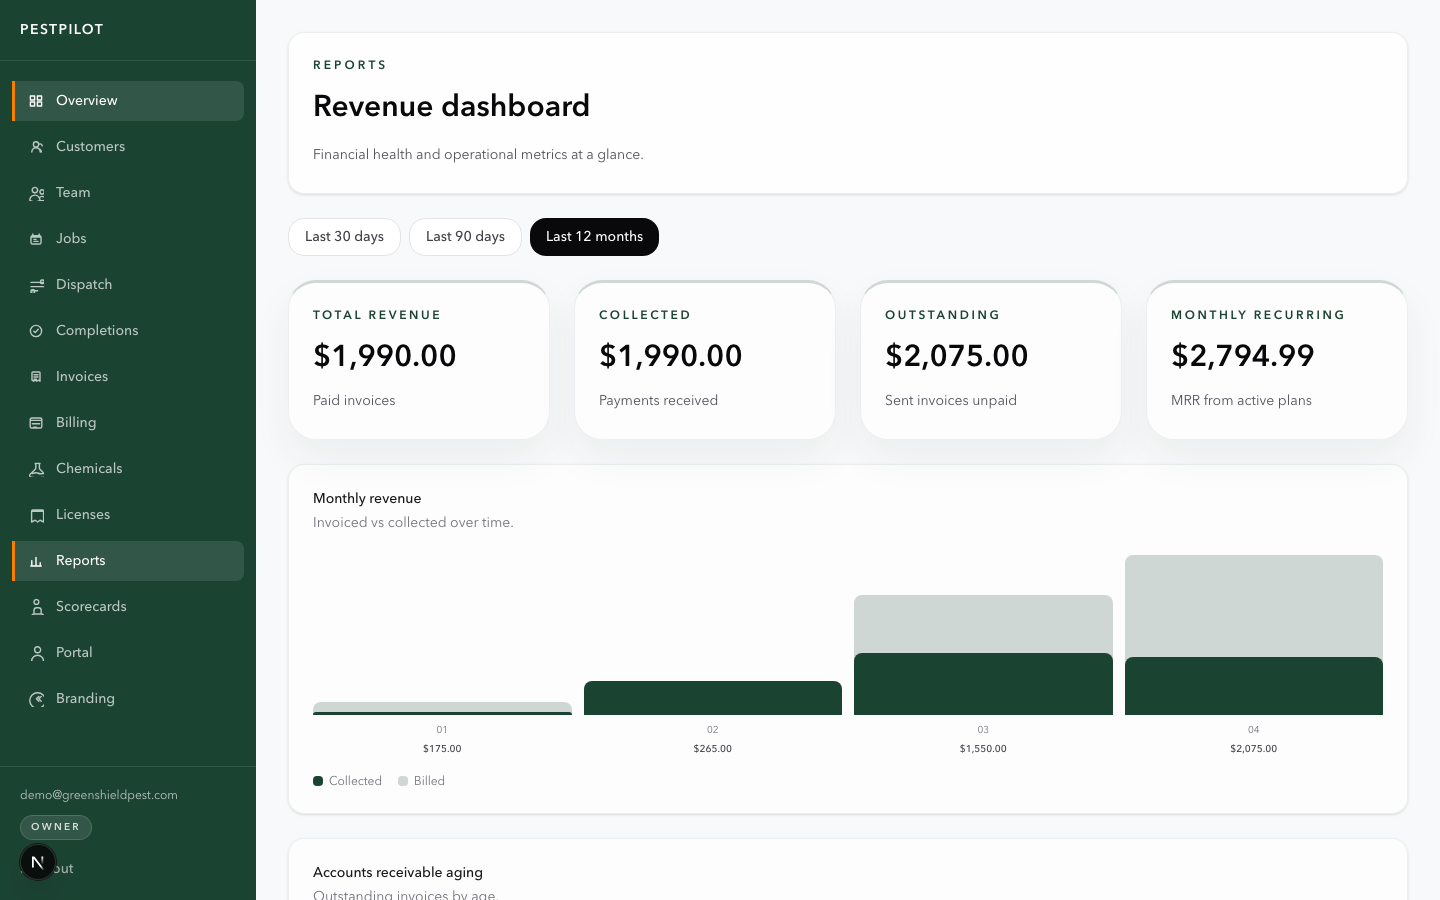
Recurring revenue dashboard
Keep an eye on the health of your route book, renewal base, and future service value in one place.
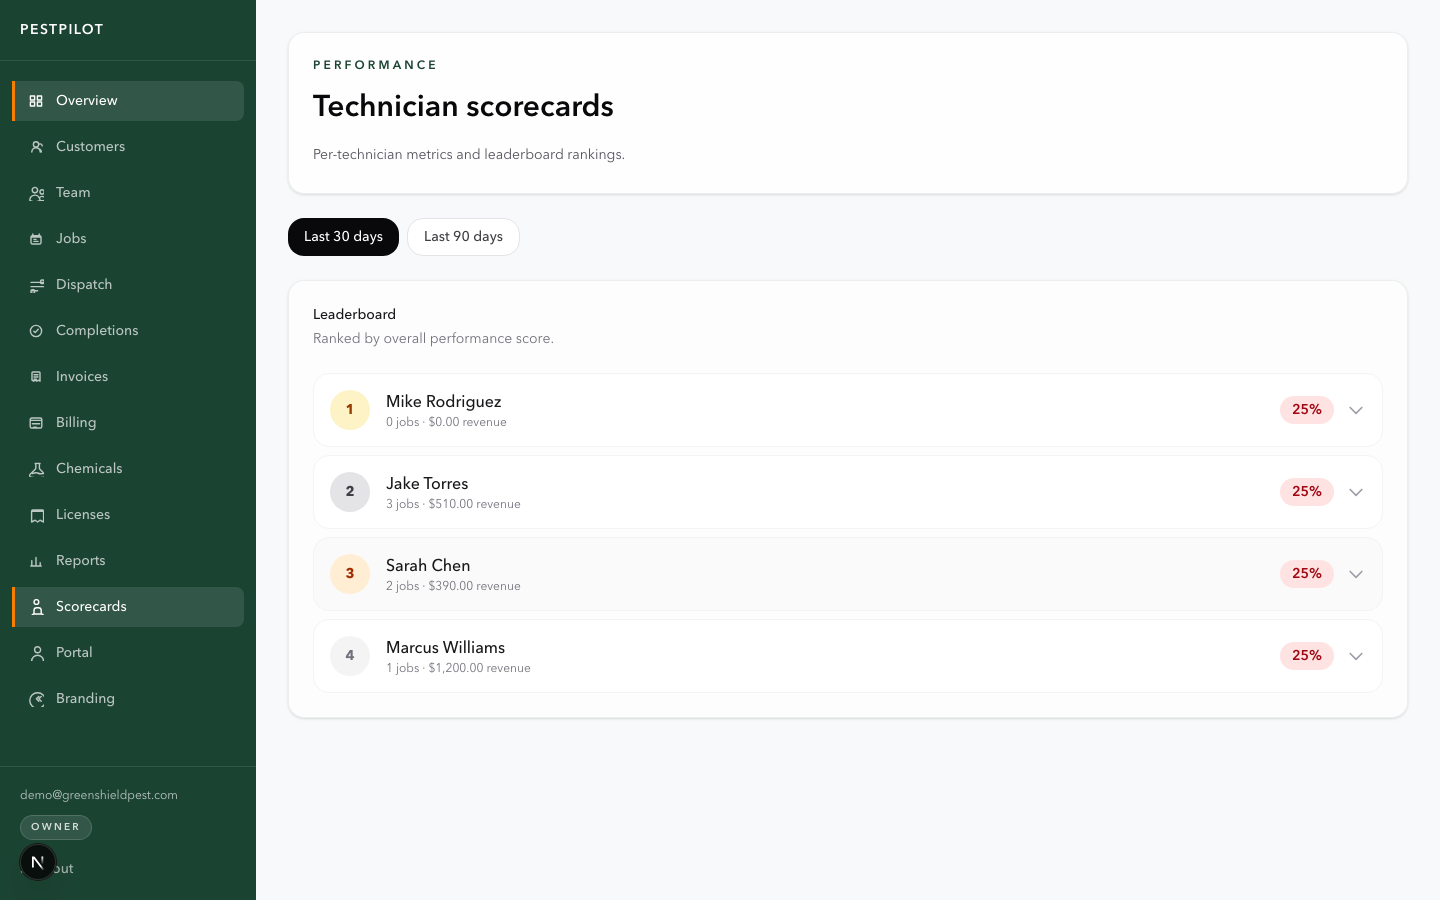
Technician scorecards for better reviews
Compare jobs completed, average service time, customer callbacks, and revenue generated across the whole team.
Make performance reviews about facts, not gut feel.
See how each technician performs — jobs completed, average service time, customer callbacks, and revenue generated. Scorecards make performance reviews data-driven instead of guesswork.
How it works
The data is already there. PestPilot turns it into something you can act on.
Data flows in from every job
Dashboards update automatically
Export or share when needed
Unlike generic field service tools, PestPilot reports on the metrics pest control operators actually manage by, from recurring revenue health to chemical usage and callback pressure.